Automatic recommendation of preparatory math courses
Automating math test creation, evaluation and feedback for STEM Master’s students
Problem statement
Students entering a Master’s program often have varied mathematical backgrounds, making it challenging to ensure adequate preparation and course placement. A self-assessment (written test) is currently used to evaluate their skills and guide module placement, along with manual, personalized course recommendations. While helpful, this process is time-consuming.
Our task then is to automate the test and it’s correction, and provide personalized recommendations to each student based on these results. Additionally, we need to make a tool that assists the teachers with decision making.
 Our entire project as a 2-panel comic strip
Solution design
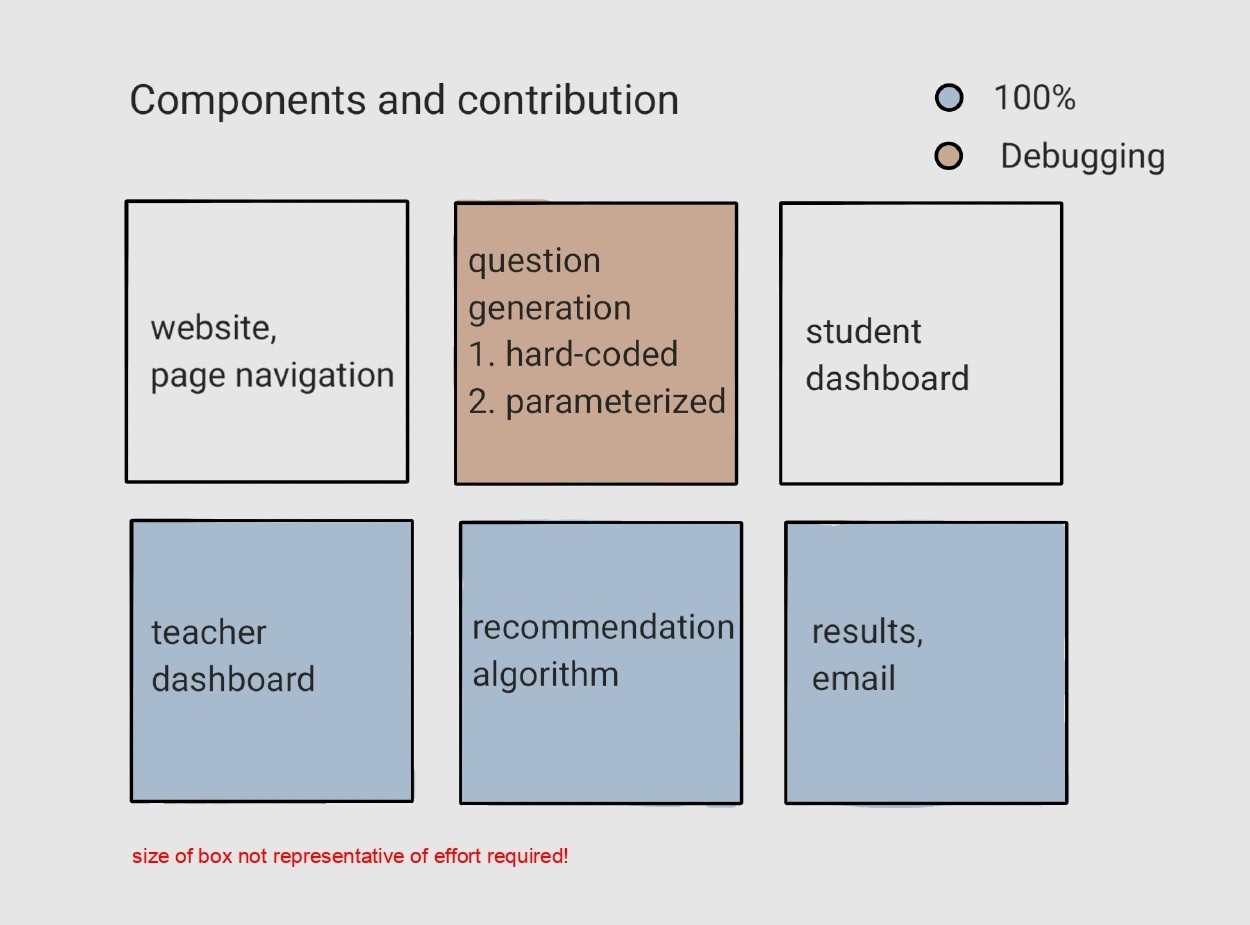
Our final solution has 6 main components, which are visualized below. I have highlighted my contributions to each component.
In order to evaluate our project (qualitatively and quantitatively), we wanted to answer the following research questions:
- How much time and effort is saved by automating assessment and recommendations?
- Are the test questions sufficiently randomized to prevent excess similarity between tests?
- How effective are the recommendations in developing students’ mathematical abilities?
- What is the general perception of the automated assessment and recommendations tool among students are professors?
- How does the quality of the recommendations compare to those provided by human teachers?
A detailed explanation of each of the components follows.
Website
The test is hosted as a website, created using Streamlit (Python library for web development). We chose to use Streamlit for the following reasons: (i) Support for LaTeX rendering, forms, plots, and input fields, enabling a wide range of question types and visualizations (ii) It makes tasks like page transitions, layout, and cross-platform compatibility easy by handling the web development for us, allowing us to focus on the technical aspects of the project (iii) Support for hosting the web app on cloud servers free of cost
The student navigates through the following pages in sequence on the website: login $\to$ subject familiarity $\to$ test questions $\to$ recommendations + student dashboard.
We implement basic regular expressions at the login page to check for valid names and student emails. The familiarity page asks the students to pick one of two familiarities (“Never studied”, “Studied before”) for 5 Mathematics topics. The student sees questions only for those topics that they have seen before, while no questions are shown for topics reported as “Never studied”. We mark all those questions as incorrect in the final results.
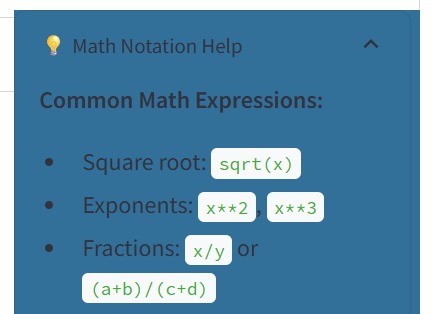
Since the students are required to enter their answers in Python syntax, a dedicated drop down button titled “Math Notation Help” is provided at the top right of the test page, providing help for inputting user answers. These contain support for all the symbols that a student will require for this test.
Besides this drop down, hints are provided throughout the website to make the navigation easier. The answer for each question needs to be submitted in order to be considered, and there is a final submit button that reminds the students to re-confirm before submitting.
Question generation
The test includes a total of 22 questions across 5 topics in Mathematics: calculus, linear algebra, trigonometry, complex numbers, exponential functions, and logarithms. It includes questions suitable for advanced high school students and first-year undergraduate students.
Each question is associated to both a topic and a concept. For example, [Q2, linear algebra, matrix multiplication]. Hence, besides the topic familiarity before the start of the exam, the student is required to enter their familiarity at each question (concept) as well.
Aside from “Math Notation Help”, hints are also provided at each question level. Since students enter their answers in python syntax, there may be confusion related to the correctness of their input. To mitigate this, we render their responses in LaTeX so they can be confident of their input.
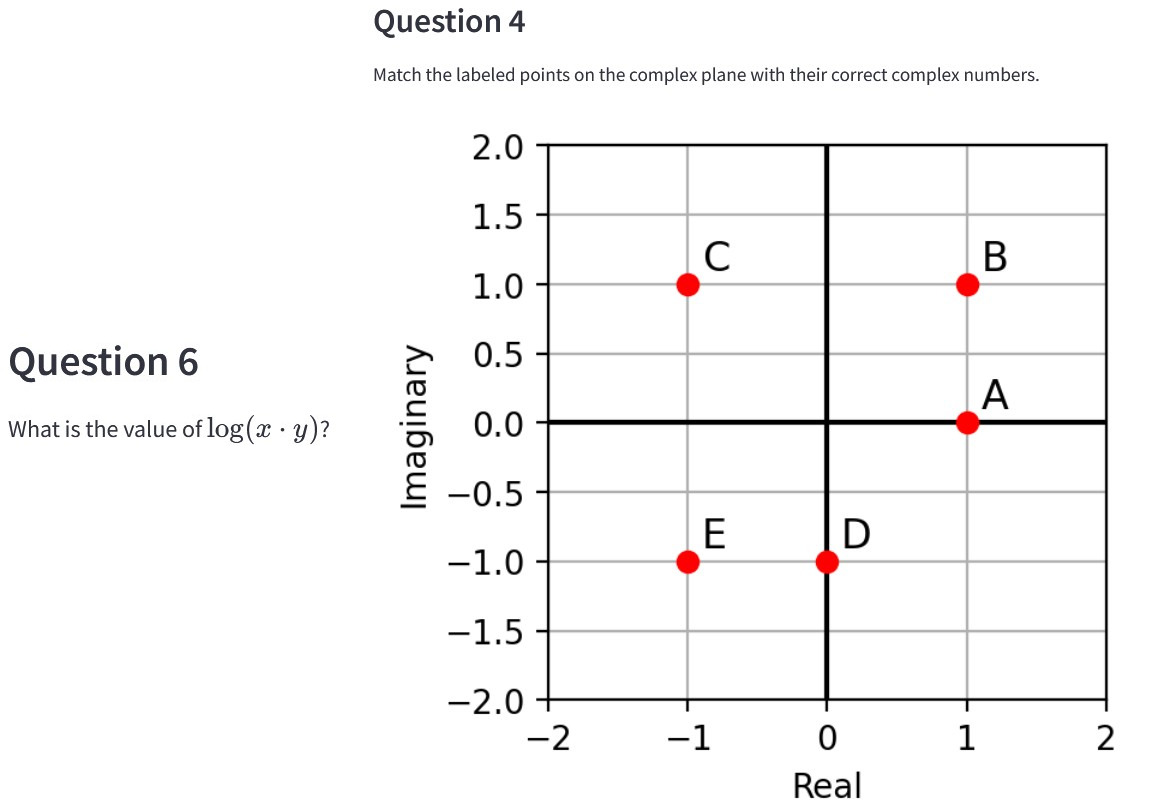
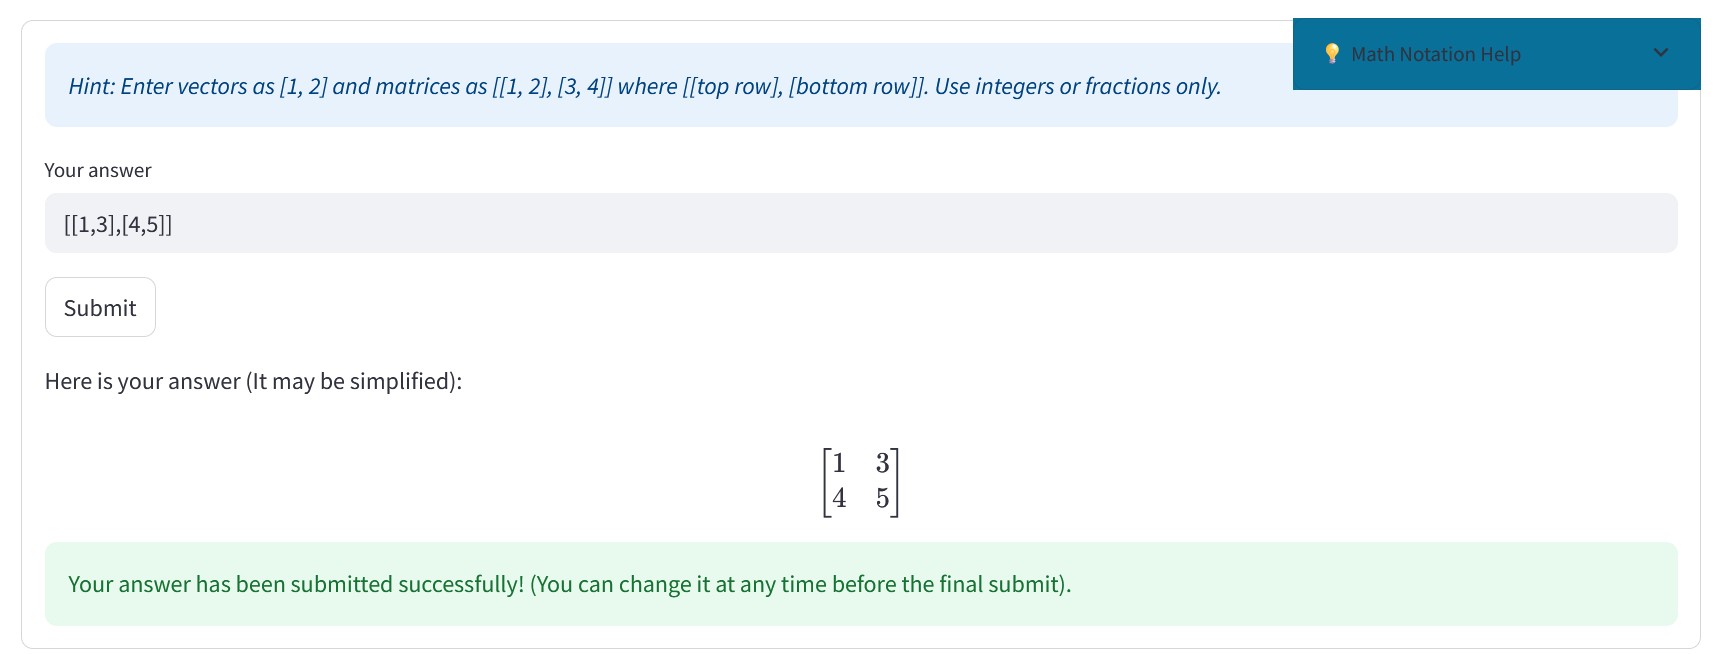 An example question from the test
The questions generated of of two main types, as discussed below.
-
Parametrized: In this system, specific components of a mathematical expression are defined as parameters that are randomly instantiated for each question. For instance, in the quadratic equation $ax^{2} + b x + c$, the coefficients a, b, and c are parameters assigned random integer values within a specified range, such as [−5, 5].
-
Hard-coded: These problems remain the same on each test, and are used to test some foundational ideas that cannot be randomized, and need to remain unchanged. Examples of this include formulas, theorems and matching functions to their corresponding graphs.
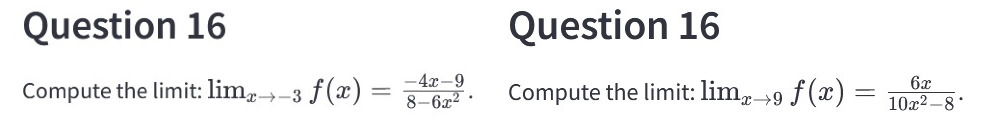 Two instances of the same parameterized question on different tests
 Some hard-coded questions
Recommendation algorithm
We chose to recommend Khan Academy lessons since they contain video & written explanations, practice questions, and their solutions. They are one of the most complete and thorough free educational resources on the internet, trusted by many students from all over the world. This makes it the ideal resource to recommend to our students, who have diverse backgrounds in mathematics and require material that teaches from first principles.
Since each of our questions has a main topic and concept associated with it, we manually compiled resources at the concept level. We found that full Khan Academy units often times have a lot of content, which can be overwhelming and confusing if recommended as a whole. For this reason, we recommend at the individual lesson or video level, suggesting resources specifically targeting the concept of an incorrectly answered question. Studying the material suggested is sufficient for covering the student’s knowledge gap, and other videos can be explored based on the student’s interest.
Having collected resources at the concept level, we had to arrange them in the correct order. For example: System of Linear Equations $\to$ Matrix multiplication $\to$ Inverses. Recommending the concepts in the correct logical order is crucial.
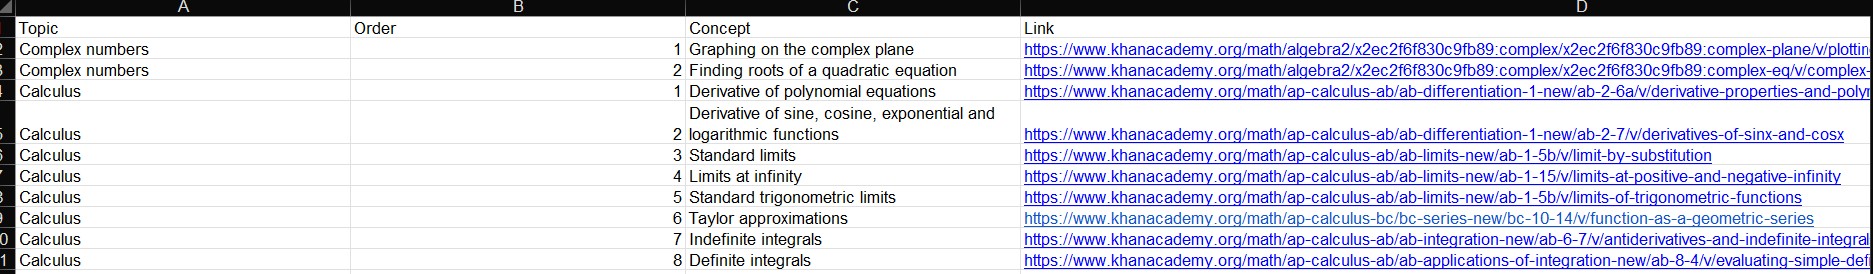 The compiled resources for complex numbers and calculus
We apply content-based recommendations and provide customized recommendations to each student based on their test results. We take the entire students’ results as input, where each row is [ question #, score (1 if correct and 0 if wrong), Concept, Topic, Familiarity. ] The student’s answers themselves aren’t taken into consideration while making recommendations, but are sent to the professor.
Note: remember that no questions from topics ‘Never studied before’ are not shown, and all such rows are marked 0 by default.
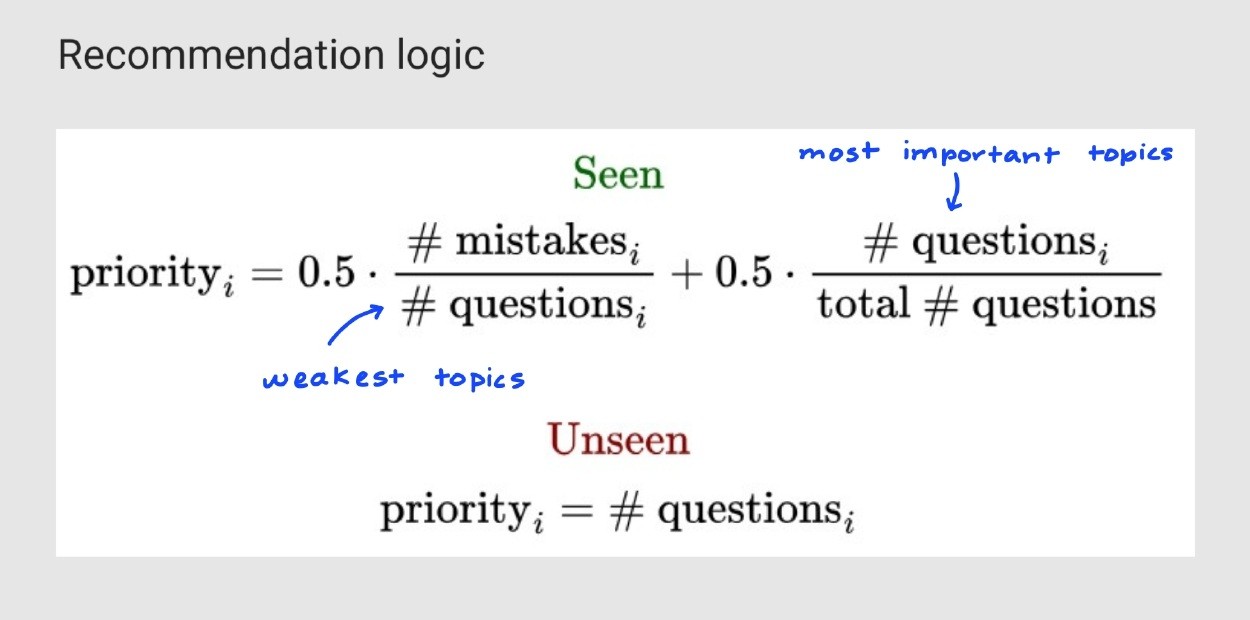
Taking this as input, we need to make two sets of recommendations. One set for topics that the student hasn’t studied before, and another for topics that he has seen and attempted on the test. We do this by defining two priority scores for topics, as explained below.
For seen topics, the idea is to prioritize those which are most difficult and contain most questions on the test. For example, if linear algebra and calculus have the same number of questions, and I have made more mistakes in linear algebra, then it gets a higher priority. Similarly, if I make more mistakes
For unseen topics our work is simplified by design (above mentioned Note), questions with most number of questions have highest number of questions. This intuition is formalized in the following way:
After ordering the topics in descending order of (respective) priority, we go through this table one by one and collect all concepts from the test associated with each topic, where a mistake was made i.e. score=0. These concepts are then ordered logically, and their corresponding links are found from the resource list compiled above. Finally, two tables are made where each row is concept, link—one for seen topics and one for unseen topics. We provide the top 3 recommendations for each type, based on their priorities, in correct logical order of subtopics. The student then has the choice to see all the other recommendations too, if they wish.
Since the test can contain multiple questions of the same concept, we ensure that all duplicates are taken care of and each unique concept is recommended only once.
We provide recommendations only for those students who score less than 80%. This threshold was determined empirically based on past results.
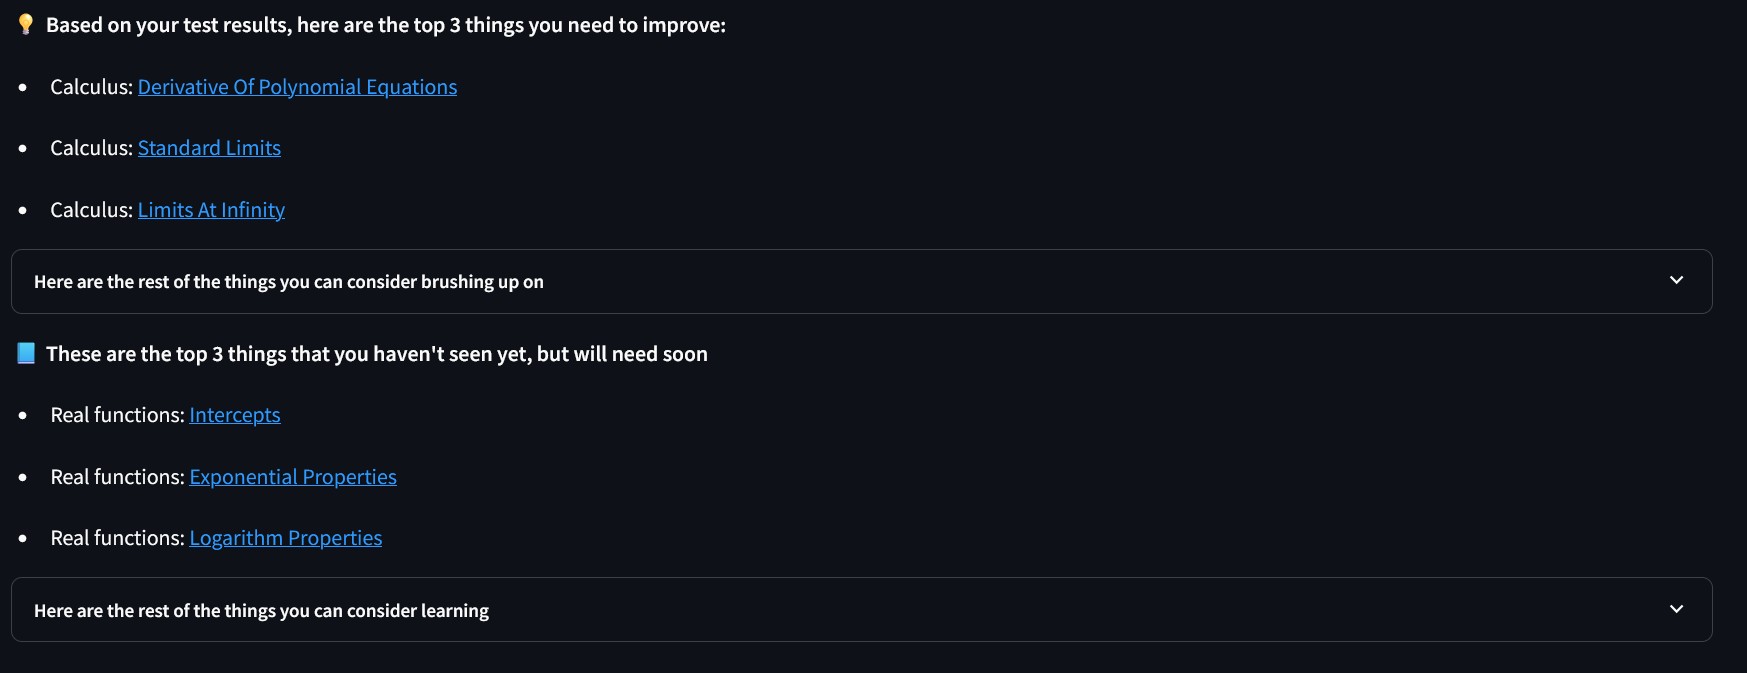 An example set of recommendations that the student sees on the website.
Student dashboard
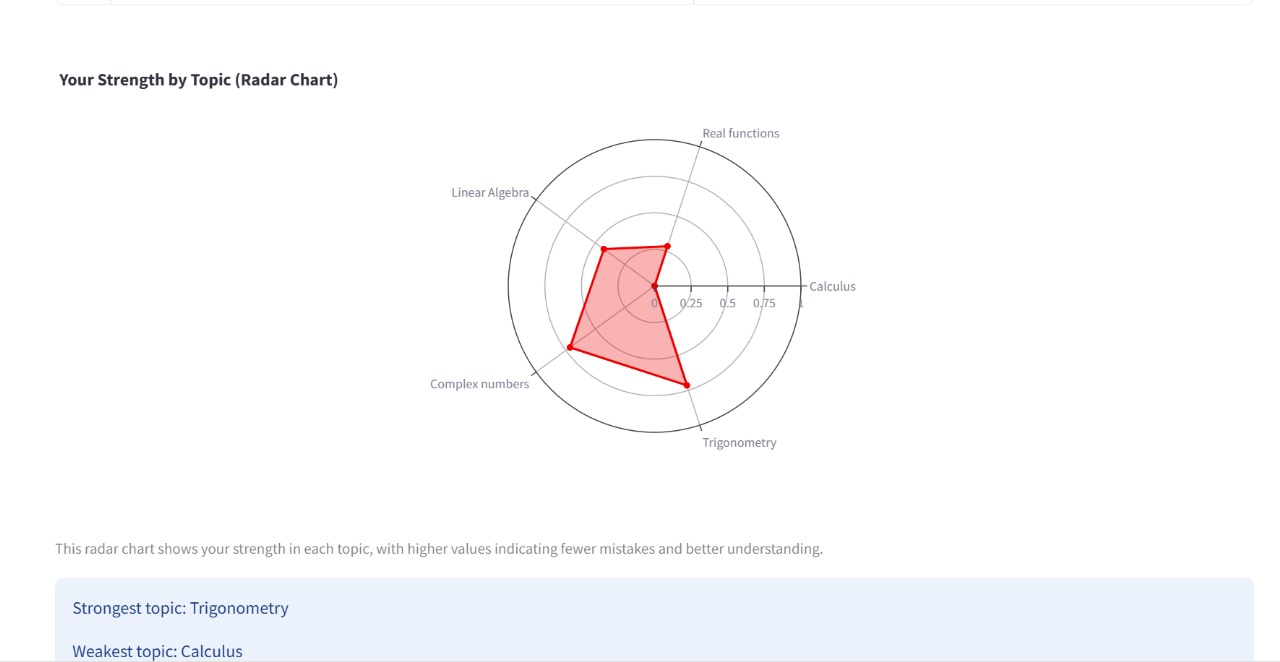
After completing the test, students are shown an interactive dashboard that visually highlights their performance and key strengths. Rather than presenting just raw numbers, the dashboard is designed to offer meaningful insights that help students reflect on their results, identify areas for improvement, and gain a deeper understanding of their progress. In particular, it contains the following visuals:
- Radar chart: Each axis represents a topic, and points closer to the outer edge indicate stronger performance. This helps students quickly identify their strengths and weaknesses.
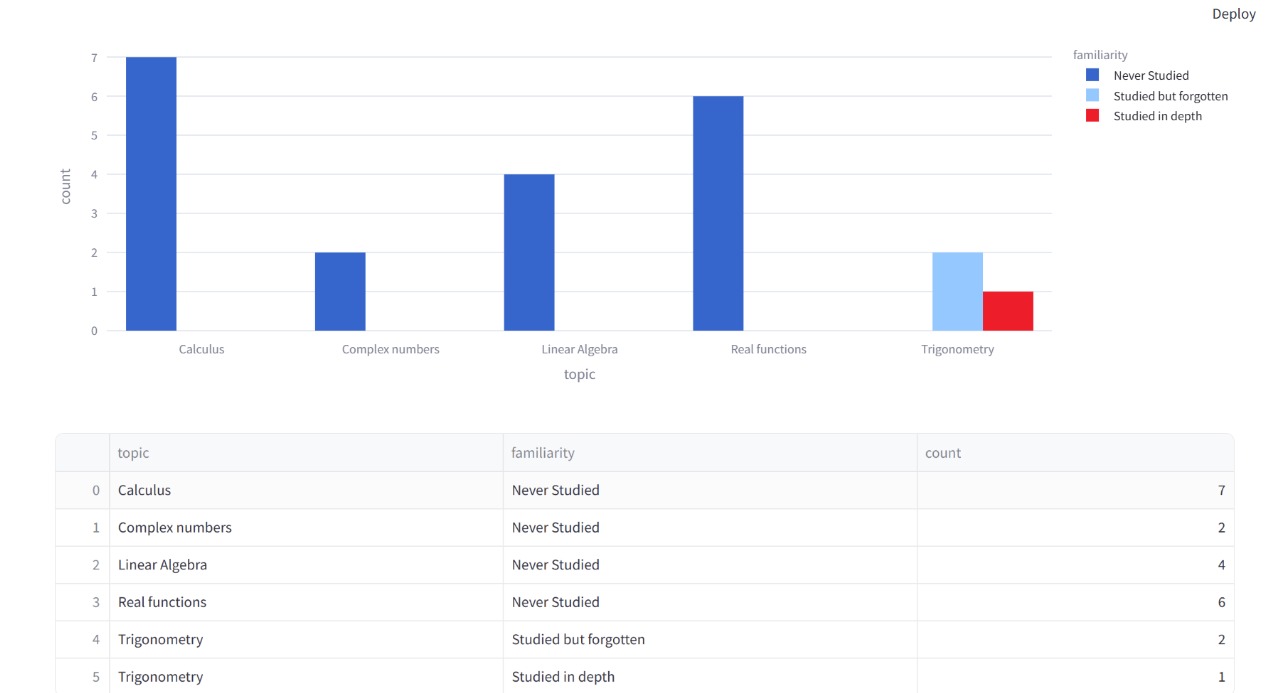
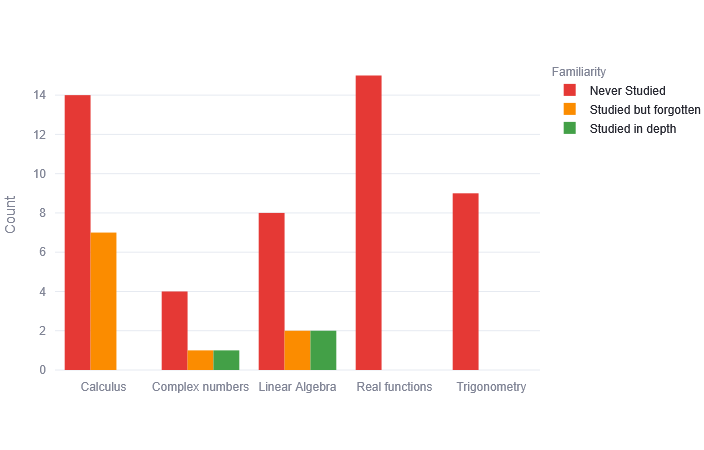
- Familiarity bar chart: This chart shows how many questions fall under each familiarity level based on the student’s self-assessment. It helps highlight areas that may need more review.
Output and delivery
Upon test completion, an email from readysetmath01@gmail.com is sent to the student and the professor. This email contains the following files:
-
Recommendations:: The recommendations provided to the student on the website are converted into a pdf file(s), preserving their original order. Two separate files are generated, one for seen topics and another for unseen topics. Depending on the student’s responses, they may receive one or both of these pdfs.
-
Answer review: This document summarizes each question answered by the student. It indicates whether the response was correct, shows the student’s answer alongside the correct solution, and specifies the topic and concept. This helps students understand and compare their mistakes and revisit key concepts.
-
Raw results: A .csv file is generated for each student containing all answers, scores, topic, concept and familiarity level. Each row here corresponds to a single question. This format allows teachers to analyze performance at scale or import data into other tools like the teacher dashboard.
The system is designed to minimize data storage while still providing useful outputs for both students and professors. Student responses are temporarily stored in memory during the session and compiled into structured formats such as json and .csv files upon test submission.
Email credentials are stored in a secrets.toml file and loaded securely. This ensures that passwords and sensitive configuration details are never exposed in code or version control.
The system does not include any third-party tracking scripts, cookies, or analytics services, maintaining a privacy-first environment.
In line with GDPR guidelines, no personal data is stored after processing, ensuring student privacy and compliance with ethical data handling standards. The credentials for the email are shared with the teacher in charge, and can be changed subsequently without affecting the functionality.
Teacher dashboard
Teachers also have access to an interactive no-code dashboard (hosted as a website), offering visual insights into overall class performance. This is designed to help the teacher quickly analyze student results and gain some basic insights to use their time more productively. In particular, it contains the following visuals:
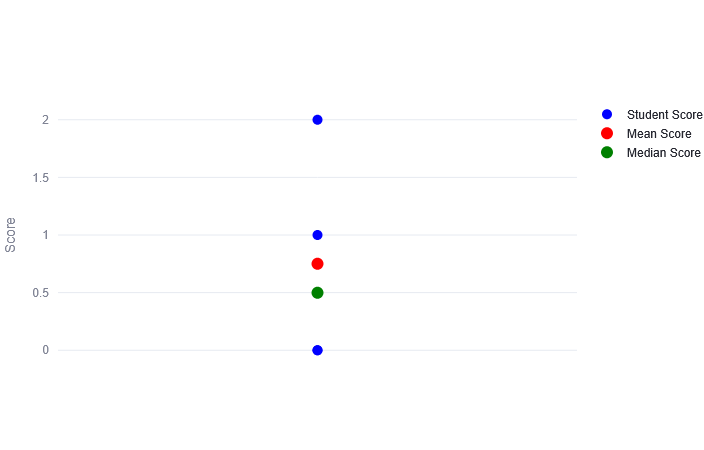
- Box plot: Shows score distribution, including mean and median values.
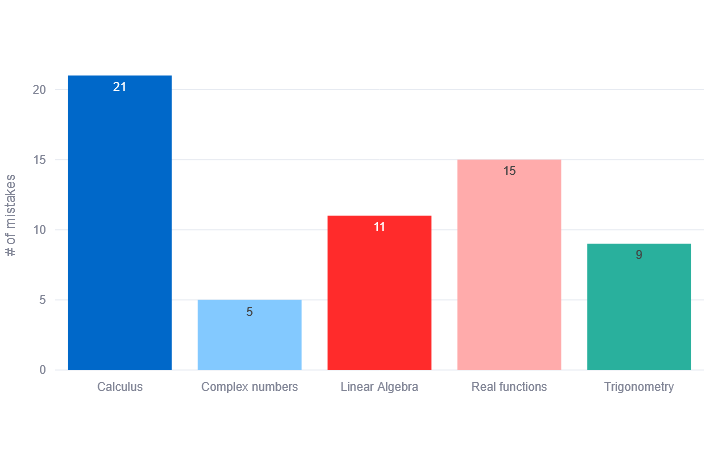
- Topic mistakes chart: A bar chart highlighting which topics had the most mistakes, helping identify difficult topics.
- Topic familiarity chart: A grouped bar chart comparing familiarity levels across topics.
The teacher needs to download the .csv files attached in the email, add them in one excel sheet and upload this sheet to the website.
Results
In previous years, correcting tests and preparing recommendations manually required roughly a full day. With the number of applicants growing annually, automating this entire process is expected to help save more time.
14 out of 22 test questions (64%) are parameterized, each randomly instantiating variables within defined ranges. On average, the probability that two questions of the same type are different is 0.88. The probability that two complete test papers are identical is effectively zero (∼ 0), confirming that the assessment is sufficiently randomized. Full calculations are available in the Appendix.
To evaluate user experience and effectiveness, we deployed the website and survey one week before the deadline. Through word of mouth, we gathered 10 responses from Bachelor’s and Master’s students at Maastricht University.
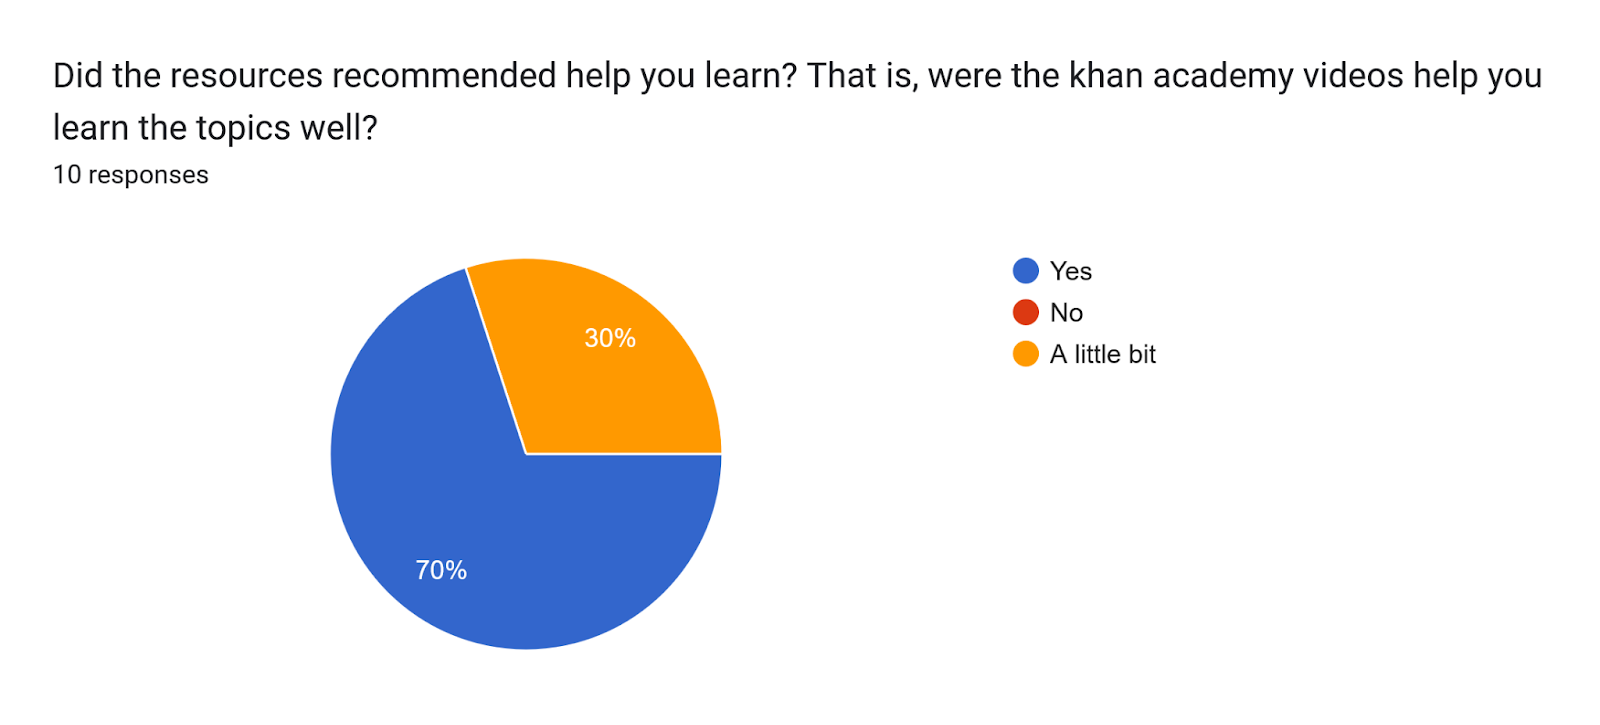 The recommendations are effective in improving mathematical-ability.
However, we acknowledge two limitations: (i) respondents came from different academic programs and may not have studied the materials in depth given the time constraints, and (ii) there was no post-test to objectively measure learning gains. More structured follow ups in the future will allow for a more accurate evaluation of recommendation effectiveness.
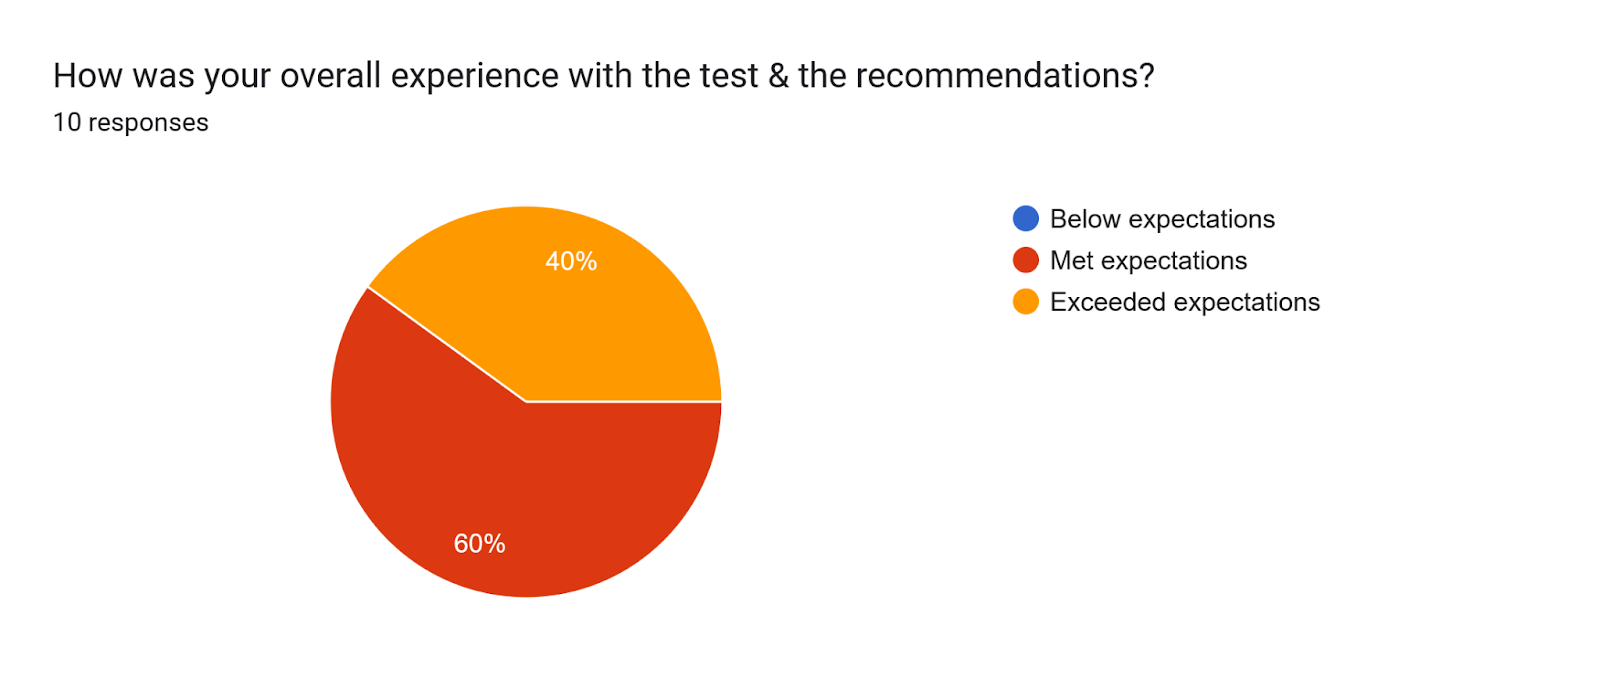 The tool is generally well-received.
Besides answering our research questions, the results from the survey were very useful in identifying bugs (UI/UX, final output, page navigation, …) that we missed to catch, and improved the final product significantly.
Finally, we compared our system’s recommendations with anonymized test results and feedback from previous years. By simulating student responses, we verified that our tool produced similar—and in some cases identical—recommendations to those made manually. Even when different units were suggested, they covered equivalent content. Hence, the system’s recommendations are of comparable quality to those given by human instructors.
Where do we go from here?
The application provides a clear and easy-to-follow process—from logging in, selecting topics, answering questions, to receiving personalized feedback and recommendations. Features like dropdown menus, math notation help, instant feedback, and visual summaries make the system easy to use and helpful for students. These design choices reduce confusion and help students focus on learning. The teacher dashboard provides a quick, no-code option to analyze student performance and helps them use their time more productively.
While our solution works well, here are the most important directions for future improvement:
-
Everybody sees the same number of questions: There are a total of 22 possible questions on the test. Students that have never studied a topic before, see those many lesser questions. It could be made that more questions are added from topics that the student has studied before. We chose not to do this because: (i) it would be difficult to compare raw scores (ii) limited logic for unique question generation, and didn’t want to repeat concepts.
-
Binary marks only (0/1): It may be the case that a student has solved most of the problem correctly, and made a mistake in the final step as a silly mistake (concentration error, time pressure error, etc.). It is incorrect to mark this as 0. Partial marks should be awarded, and the recommendation logic needs to be modified to handle partial scores as well.
-
No hand written inputs: Students are quired to enter the input as math syntax, and while there are detailed instructions for doing so, this format limits the types of questions we can ask. For example, they cannot draw the graph of a given function, find intersections of two or more functions, etc. Not allowing hand-written input also limits the complexity of the questions that can be asked. Longer questions that involve multiple steps cannot be checked, and neither can proof based questions be asked. A good place to start accepting handwritten input may be the Mathpix API.
-
Rule based recommendations: Our current recommendation logic is simple and effective, designed to be interpretable and provide consistent recommendations. Experiments can be conducted where the test results are fed into an Large Language Model (LLM) like ChatGPT and it is asked to provide recommendations. The LLM can search the internet and provided recommendations based on student preference (youtube videos, textbooks, language support, etc.). An LLM may be able to generate a detailed study plan, taking the student’s available time as input and making a schedule based on the time required to complete suggested resources.
-
No order between topics: Our goal was to recommend the 3 most important topics possible. We define importance as topics that will be required the most in their upcoming courses, things they can learn that will help them score higher in their program. This means our algorithm is biased to the concepts that have more questions on the test. However, this will not always preserve the logical order for learning courses. For example, real functions need to be studied before calculus.
-
No “Never studied before” option at the question level: Questions from topics never studied before are not shown on the test, and their answers are forced to be incorrect (0). The recommendation logic also splits topics into “Never studied before” and “Studied before”, with each having a separate priority. For these reasons (we would also have to change our underlying data structure a lot), we do not accept “Never studied before” as an option at the individual question level. This is incorrect, I may have studied calculus before, upto differentiation but may have never seen Taylor expansions before. Future versions need to account for this, and modify their data structures and recommendation logic accordingly.
-
No memory: Since we don’t store any student data, the test and recommendations are a one time tool. If we were able to store the student’s results, this test (informed on user and past scores) could be taken again as a way to objectively measure the improvement in the student’s ability due to the intervention. Only questions from sections that require help could be asked, and many more visuals could be provided to the student and teacher’s in addition. Since giving tests, receiving immediate feedback & follow-up advice is the best way to learn, using this tool iteratively throughout the entire course would be ideal.
Thank you for reading the entire article, I appreciate it a lot :) While this article explains everything thoroughly, I find watching the application in action is a lot more magical and illustrative. A 7 minute demo of our project can be found here.
Appendix
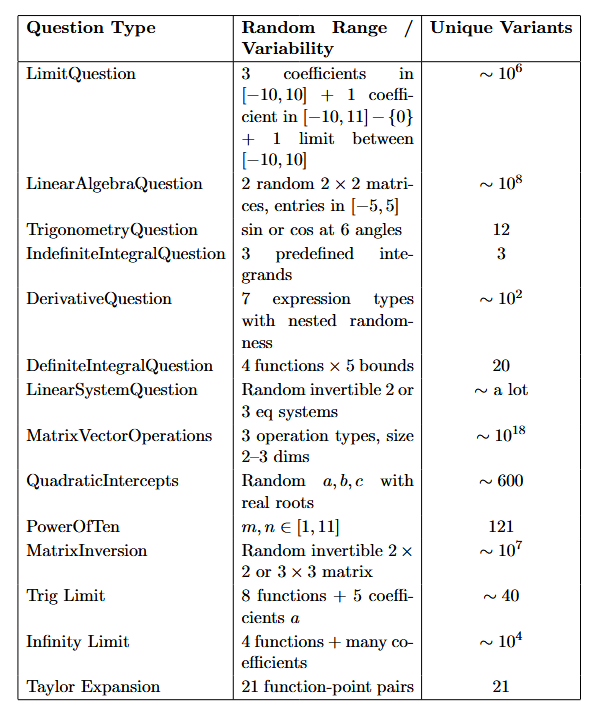
Randomness and estimated variants for all parametrized questions
Here, the probability that two questions from the same type are different is
\[1 - \frac{1}{\text{unique variants}}\]Hence, the average probability that two generated questions of the same type are different is 0.88.
Since all 14 questions are independently generated, the probability that two full papers are identical is:
\[u = \prod_{i=1}^{14} (1 - p_{i}) \approx 0\]Therefore, the probability that two full papers are different is:
\[1 - 0 \sim 1\]
Leave a comment